Overview
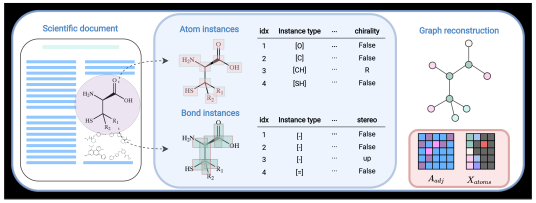
A chemical diagram is a drawing and a graph at the same time. A machine can learn to translate the picture into a line of symbols, or it can identify the pieces and assemble their connections. CEDe gives the second approach the detailed annotations it needs. Each example can show where the model was supposed to find an atom, bond, or other part of the diagram.
Key Findings
Reading a molecule the way a chemist does
Picture a patent page where a drug candidate appears only as a drawing. No text file lists its atoms, and a search engine cannot find it. Optical chemical structure recognition (OCSR) aims to turn that drawing into a machine-readable record such as a SMILES string, a line of text that encodes a molecule. Moontae and his colleagues at LG AI Research and KAIST argue that most recent learning-based systems approach this like image captioning. They read the whole picture and write out a string, and the authors report that this takes millions of training examples just to match older rule-based tools such as Imago, MolVec, and OSRA.
Detecting the parts gives a model many chances to learn from each image. One drawing can contain dozens of examples of atoms or bonds, and a reconstructed graph can point a reviewer back to the visual evidence for each of them. The team assembled atom-level boxes for four real collections so it could test that approach on chemical diagrams from actual publications and patents.
Four real collections, labeled by experts
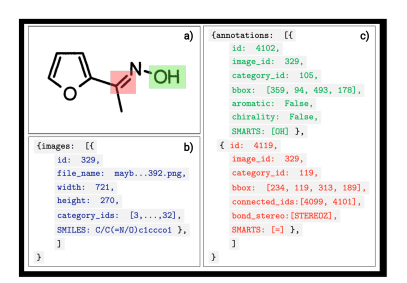
CEDe supplies those boxes for four widely used collections. According to Table 1, UOB holds 5,740 images, USPTO 5,719, CLEF 961, and JPO 450. The authors report more than 10,000 images and over 700,000 instance annotations in total. Experts drew the boxes in COCO format, with coordinates and a multi-label for each instance.
The label set carries information that pixels alone do not show. Implicit hydrogen counts, aromaticity, and chirality rarely appear as symbols, so the authors derived reference SMARTS tokens from the MOL and SDF ground-truth files with RDKit. Annotators could then see which labels each image should contain. Stereo bonds receive labels such as [STEREOE] and [STEREOZ].
Pseudoatoms, the abbreviations chemists scatter through drawings, fall into three subcategories. "[element]" covers letters that map to one atom. "[atom_bundle]" covers groups such as t-Bu, which maps to a small subgraph query. "[OCR]" covers symbols such as R1 or X that point elsewhere in the structure. The baselines group unseen pseudoatoms into an "others" class and read them with OCR tools.
Catching annotation errors
Human labels contain mistakes, so the authors checked them several ways. Each image must contain enough instances to rebuild the structure. Boxes must match the SMARTS substructures in the ground-truth file. Box sizes and positions must stay within the distribution for their class. Connected boxes must respect valency rules. Letter annotations get cross-checked among OCR output, the molecular file, and the human label. The authors also tighten letter boxes by cropping white space, and they provide a script for that step.
A million synthetic molecules with style variation
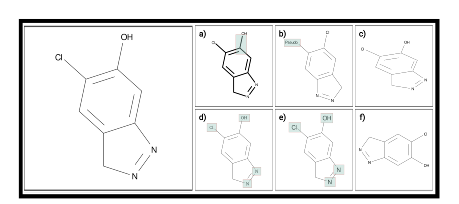
Real annotation is expensive, so the team also released a synthetic set. They sampled one million structures from PubChem without limits on size or element type, and rendered them at 768 by 768 pixels with RDKit, which computes boxes during rendering. Six style augmentations aim to narrow the gap with real documents. They vary line thickness, substitute random pseudoatoms, apply shear-like scaling, change font style and font size, and rotate the skeleton while keeping characters upright. The authors point out that ordinary image rotation would tilt the letters, which real documents do not show. The generation code is released and can run in parallel during training.
The benchmark design
The authors compared three detection-reconstruction baselines against three image-to-SMILES models, and also ran Imago, MolVec, and OSRA. The captioning-style models trained on all one million synthetic images. The detection models trained on 10,000, which is 1% of that, sampled so every entity type still appears. After pretraining, a 20% subset of each real dataset was pooled for fine-tuning. The authors score exact graph matching and omit similarity measures, because those can overlook rare but critical entities such as pseudoatoms.
What the numbers show
Table 2 gives exact-match percentages. The selected rows below show fine-tuned results on real data, with test sizes of 4,592 for UOB, 4,575 for USPTO, 768 for CLEF, and 360 for JPO.
| Test data | OSRA | CNN+Transformer decoder | Faster R-CNN with bond-box connectivity |
|---|---|---|---|
| UOB | 85.95 | 66.90 | 91.49 |
| USPTO | 87.83 | 55.17 | 90.97 |
| CLEF | 92.84 | 39.19 | 86.59 |
| JPO | 58.89 | 30.28 | 74.12 |
The table shows why the benchmark includes rule-based tools. On CLEF, OSRA remains the strongest of these three systems. The detection approach has a clear advantage over the image-to-SMILES baseline in all four comparisons.
On the synthetic test set, the Faster R-CNN detector with rule-based reconstruction scores 88.96%, compared with 61.2% for the best image-to-SMILES model. On JPO, applying the synthetic-only detector yields 49.44%. Fine-tuning it on real diagrams raises that to 74.12%. These are exact-match percentages, so the entire molecular graph has to be correct. The contrast makes the role of real diagram styles clearer. Synthetic renders can teach a detector what a bond looks like, while authentic drawings teach it which details are likely to be obscured or compressed in print. Table 2
Limits remain. This first release excludes Markush structures, polymers, and reaction paths, which need different reconstruction methods. The authors plan to add them.
Questions & Answers
Q: Why add boxes if you already have a molecular string?
A: A string gives the final structure. A box ties a particular image feature to a component of the structure. That additional supervision helps train a detector and helps pinpoint which part went wrong.
Q: Why require an exact graph match?
A: Similarity scores can miss rare but important symbols such as pseudoatoms. The paper uses exact matching for the complete reconstruction and reports detector mean average precision separately in the supplement.
Q: Why generate synthetic drawings too?
A: Rendering can supply many varied structures with component labels. Real diagrams add styles and artifacts that synthetic examples may not capture. The experiments compare the effects of pretraining and adaptation to real images.
Q: Which patent diagrams fall outside the dataset’s first release?
A: The first release excludes classes such as Markush diagrams, polymers, and reaction schemes. Exact graph matches and component-level scores therefore measure the diagram types represented in the benchmark. A patent workflow could detect these out-of-scope cases and send them directly to an editor, then evaluate how reliably the routing catches them.
Future Ideas
Show a chemical editor the uncertain bond
In a document-ingestion workflow, overlay proposed atoms and bonds on the source diagram. Give a reviewer the original crop and alternate interpretations when component confidence is low or the graph violates basic chemical constraints. Save each correction as a training example with its source style.
Compare this review view with whole-graph review at the same staffing budget. Use papers and patents held out by source, report exact graph accuracy and correction time, and separately count errors involving charges, pseudoatoms, and stereochemistry.
Break out review time and residual errors by diagram style and component frequency, since a strong overall graph-match score can hide errors on uncommon chemical symbols.