Overview
A sandwich tutorial might spread peanut butter first and jelly second. Another cook can reverse the order and make the same sandwich. A checklist records the order shown. A task graph tries to capture which steps actually need to happen before others. This paper asks whether a language model and a graph-building algorithm can find those relationships by comparing transcripts from many people performing the same task.
Key Findings
Every narrator leaves something out
One cook says to spread the peanut butter. Another says to coat a slice. A third carries out both actions on camera and never names them. The study starts with the automatic speech transcripts of several demonstrations of the same task. An instruction-tuned language model turns each transcript into a proposed list of steps. The use of many videos gives a step omitted by one narrator a chance to appear elsewhere. It also creates a new problem. Different words can describe the same move.
Agree on the steps before learning the order
The researchers embed the proposed steps and cluster similar descriptions. They can merge clusters when their wording is similar and the steps seldom appear together in one sequence. They relabel the demonstrations using the shared step categories, then ask GPT2-XL to score the resulting sequences. Only the top 75% pass to the graph builder. The pipeline diagram shows each handoff from transcript to graph. Figure 2
The graph builder can represent steps that need several earlier actions together and steps that can follow alternative routes. Its job is to learn the eligibility function , where records what has already happened and says what can happen next. An observed step supplies evidence that its prerequisites were met. Other steps’ eligibility is treated as unknown in that observation. The paper uses inductive logic programming with decision trees to infer the rules. Appendix A and Figure 3
The same graph can be judged in two ways
For the quantitative test, the team supplies the names of key steps. Every method can then be compared with a human graph over the same vocabulary. Accuracy measures whether both graphs agree that a step is eligible for a given set of completed actions. Selected values below are averages across five tasks per dataset. Table 1
| Method | ProceL average accuracy | CrossTask average accuracy |
|---|---|---|
| ProScript, trained on scripts | 53.9 | 64.6 |
| Graph built from raw transcript sentences | 60.1 | 61.8 |
| Graph built with language-model summaries | 66.9 | 67.6 |
| Summaries plus sequence ranking | 72.1 | 67.8 |
| Graph builder given annotated step sequences | 83.8 | 75.7 |
The ablations suggest that summarizing speech and filtering noisy sequences solve different problems. GPT2-XL also scored better on the ProceL ranking ablation than the larger GPT-J. The choice of language model mattered more than a simple increase in size. Tables 2–3
The sandwich exposes the difference between habit and necessity
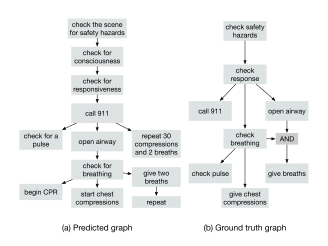
In the qualitative test, the system must discover the steps as well as their relationships. The predicted CPR graph finds details missing from the reference. The sandwich graph combines putting jelly on the bread with spreading it and concludes that peanut butter must be spread first. The human graph allows either spread to come first. The regularity in the demonstrations shows how cooks tend to proceed. The system would need evidence from other orders to distinguish that habit from a requirement. Figure 6
Questions & Answers
Q: Why use more than one video?
A: Different videos can show alternate valid orders and use different words for the same action. Comparing them provides more evidence about which steps belong to a task and which orderings recur. A collection dominated by one convention can still make an optional order appear necessary.
Q: What does the language model do?
A: The first model summarizes transcripts into steps. A second model ranks the normalized step sequences for plausibility. A separate graph algorithm infers the prerequisites from the selected sequences.
Q: Can a transcript miss an important step?
A: Yes. A person may perform an action without mentioning it. Automatic transcription can also lose words or confuse terms. The pipeline sees the text and its summaries. Other observations, such as visual evidence or an expert procedure, could help recover missing steps.
Q: Why are the annotated-sequence results below 100?
A: The comparison uses annotated step sequences to infer a graph and compares its predictions with a separately annotated reference graph. Noise in the step sequences can remain. Providing an annotated sequence therefore does not guarantee that the inferred prerequisites agree with the reference.
Q: Does the graph accuracy figure also measure whether the model discovered the right steps?
A: The quantitative comparison supplies the same key-step vocabulary to isolate prerequisite inference. The paper illustrates the complete discovery process separately. A usable graph needs both sensible steps and edges that hold under alternative valid orders. A reviewer can judge those two parts independently using the underlying transcripts.
Future Ideas
Put competing procedures side by side
A team maintaining onboarding instructions could feed the system several transcript versions of a routine procedure. For each proposed prerequisite, the editor would see the passages that support it and a matching example that uses a different order, when one exists. A domain reviewer could label the edge “required,” “usual,” or “uncertain” and export a procedure that allows approved alternatives.
Start with low-risk workflows for which the team already has approved instructions. Give reviewers a generated graph or a transcript summary, with the same time budget. Have a second expert score missing required steps, spurious prerequisites, and valid alternate paths, and record time to produce an approved result. The graph editor is worth keeping if it preserves the approved constraints and saves review time by making alternate paths easier to check.
Measure agreement as the number of demonstrations grows. An editor can distinguish a prerequisite supported by several examples from an edge that disappears when a new valid procedure is added.
Sources
Original abstract
This work explores the problem of generating task graphs of real-world activities. Different from prior formulations, we consider a setting where text transcripts of instructional videos performing a real-world activity (e.g., making coffee) are provided and the goal is to identify the key steps relevant to the task as well as the dependency relationship between these key steps. We propose a novel task graph generation approach that combines the reasoning capabilities of instruction-tuned language models along with clustering and ranking components to generate accurate task graphs in a completely unsupervised manner. We show that the proposed approach generates more accurate task graphs compared to a supervised learning approach on tasks from the ProceL and CrossTask datasets.