Overview
Picture two answers with three helpful votes and three unhelpful votes apiece. One rose to the top before the negative votes arrived. The other drew mixed reactions from the beginning. Their totals agree, but the readers who cast those votes saw different displays and different opinions from earlier readers. The Chinese Voting Process models that history to estimate how position, past votes, and the response itself shape the next vote.
Key Findings
Two answers, six votes each
Take two answers that each end with three positive and three negative votes. In the paper's first example (Table 1), one answer collects three positives and then three negatives, while another alternates. Moontae argues that the endings differ in meaning. The fourth vote on the first answer goes against a clear majority, which they treat as a harder decision that deserves more weight. Alternating votes each express weaker disagreement, so that answer looks closer to neutral. Classic self-reinforcing models, including the Chinese Restaurant Process and the Pólya urn, give both orderings the same probability, because they are exchangeable. The authors built the Chinese Voting Process (CVP) to read the order.
A reader's two decisions
The CVP splits each visit into two phases. In the selection phase, a reader either picks an existing response or writes a new one. In the voting phase, a reader who picked a response votes it up or down. Table 2 gives the rank-based weight of response at time , with measuring the community's sensitivity to high-ranked responses:
Normalizing the existing response weights together with the weight for writing a new one gives the selection probabilities. The authors fixed at 0.5 after a search. A negative lets the model describe readers who skip the top, which the paper says happens early when few responses exist.
Why the urn ratios carry history
Each response starts with pseudo-votes. As votes arrive, the model updates two features, and , the positive and negative shares of votes recorded so far. With denoting response length relative to other responses to item , Table 2 gives the probability that the next vote on response is positive:
Here is the logistic function and is the response's estimated intrinsic quality. The weights and describe the effect of earlier positive and negative shares. The per-item weight captures length preference. A positive vote contributes probability , and a negative vote contributes . In the paper's toy example the regression omits relative length, starts at the second vote, and uses an penalty to keep estimates finite even for a one-sided history.
These are the estimates in Table 3 after each vote, with both responses starting at one positive and one negative pseudo-vote.
| Vote received | First response | Its quality estimate | Second response | Its quality estimate |
|---|---|---|---|---|
| 1 | Positive | — | Positive | — |
| 2 | Positive | 0.363 | Negative | −0.363 |
| 3 | Positive | 0.574 | Positive | 0.004 |
| 4 | Negative | 0.237 | Negative | −0.230 |
| 5 | Negative | 0.004 | Positive | 0.007 |
| 6 | Negative | −0.175 | Negative | −0.166 |
The first response's estimate drops from 0.574 to 0.237 when a reader votes against the early consensus. The two responses finish with the same totals and different estimates. The authors report that using raw vote counts as features would keep the first estimate rising through its three negative votes.
Fitting a process that depends on its own past
A non-exchangeable process looks hard to fit. The authors note that the full trajectories are observed, including the rank each reader saw. Conditional on the observed history, the likelihood splits into a voting piece and a selection piece. The voting piece becomes regularized logistic regression, and with fixed the selection piece is convex in .
For community comparison they define Trendiness as . Conformity is the geometric mean of odds ratios for following versus opposing the current majority. It uses parameters refit at each time step, since a reader cannot see future votes.
Data and the first test
The data include 363 Amazon products, kept from 595 after filtering, and 82 StackExchange forums with at least 100 qualifying questions. The prediction task fits the model up to time and scores action .
Table 5 reports average negative log-likelihood over the first 50 votes, where lower is better. The baseline is a Chinese Restaurant Process that weights responses by vote count.
| Community | CRP selection | CVP selection | Residual, display rank | Residual, quality |
|---|---|---|---|---|
| StackOverflow | 2.152 | 1.989 | .005 | .003 |
| Mathematics | 1.841 | 1.876 | .014 | .008 |
| Amazon | 2.597 | 2.261 | .023 | .016 |
| Meta StackOverflow | 1.411 | 1.575 | .018 | .013 |
The CVP wins in most forums. Mathematics and Meta StackOverflow are two exceptions where the baseline performs better. The advantage shrinks as votes accumulate, and for items past 50 timesteps the authors report no significant difference. In the voting phase, positive votes dominate every community, which makes gains hard. Even so, the authors report that every reduced model differs significantly from the full model by one-way ANOVA in the major communities. Quality, opinion ratios, and length each contributed.
Checking quality against comments
Intrinsic quality has no direct ground truth, so the authors used comments as a second signal. Figure 2 covers StackOverflow, with 337k comments on 104k responses.
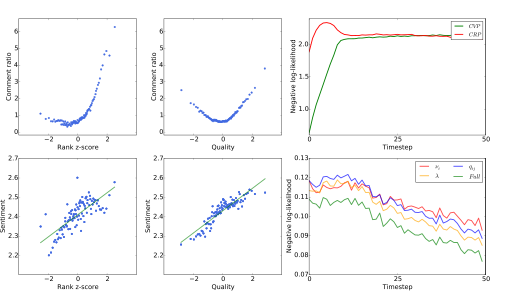
Higher-ranked responses draw more comments, and responses at both high and low quality draw more comments. Sentiment follows quality more cleanly. Across all 83 communities, the paper reports weighted average residuals of 0.012 for quality rank and 0.028 for display rank, and bumpiness falling from 0.391 to 0.226. The residual columns in Table 5 show the same direction in each listed community. Comments can still be affected by who sees a response, so this supports the quality scores without proving them.
Mapping community cultures
Trendiness and Conformity place each community on a plane in Figure 1.
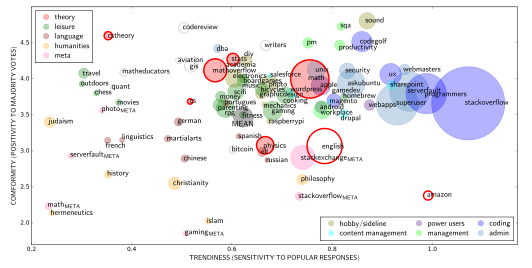
Religion, scholarship, and meta forums sit at low Trendiness, where readers spread votes across many opinions. Theoretical computer science has low Trendiness and high Conformity. Applied communities such as physics and math are trendier, and Amazon readers are the most trend-sensitive and the least afraid of minority opinions.
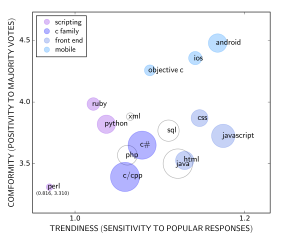
The authors also asked whether Trendiness merely reflects size. Splitting StackOverflow by language (Figure 3) yields distinguishable averages that all stay in one region. JavaScript users are more satisfied with trendy answers than C and C++ users, mobile developers lean conformist, and Perl users argue more. The authors conclude that community character shapes voting more than technical similarity. They also treat as community-level, noting it could be extended to per-item values.
Questions & Answers
Q: Why can’t we use the final helpful-vote percentage?
A: The percentage discards the history of what each voter saw. When someone votes against an early consensus, the model treats that vote in light of the previous opinions. The same final ratio can emerge from very different histories.
Q: What if I have the votes but no record of which answer was shown first?
A: The selection model depends on the display rank at each decision. The paper uses observed trajectories and discusses limitations where ordering rules or tie breaks are uncertain. A deployment would benefit from recording impressions and rank directly.
Q: Is the quality score a verdict about an answer?
A: It is a model-based estimate of how the response would fare after accounting for the included variables. A correctness audit would require an independent way to assess the answer, such as blinded expert annotation or a reproducible test.
Q: Do the votes establish that display position causes the apparent quality gap?
A: The historical data let the model estimate how rank and earlier votes relate to later behavior. Rank, response age, and who reads a thread can also change together. A randomized ordering with recorded impressions would help isolate the effect of position, while blinded usefulness judgments provide a measure outside the same voting process.
Future Ideas
Measure the answers a forum overlooks
For an opt-in sample of low-risk question threads, rotate eligible answers among a small set of positions and record their impressions. Ask independent reviewers to rate a stratified sample of answers while hiding their vote totals. Use the observed votes to compare a score based on vote history with the current ordering and an impression-adjusted vote baseline.
The key outcome is whether the score surfaces more independently verified useful answers per review, especially among recent or previously low-exposure posts. Keep the trial small enough for manual quality checks and estimate performance separately on new and established answers before using the score to reorder the site.
Predeclare the observation window for new answers. Compare their estimates at equal age and separately by impression count, so an apparent early gain does not simply reflect more time on screen.
Sources
Original abstract
Many online communities present user-contributed responses such as reviews of products and answers to questions. User-provided helpfulness votes can highlight the most useful responses, but voting is a social process that can gain momentum based on the popularity of responses and the polarity of existing votes. We propose the Chinese Voting Process (CVP) which models the evolution of helpfulness votes as a self-reinforcing process dependent on position and presentation biases. We evaluate this model on Amazon product reviews and more than 80 StackExchange forums, measuring the intrinsic quality of individual responses and behavioral coefficients of different communities.