Overview
An online directory branches into increasingly specific pages. A social group may have many routes that loop back to the same people. Representing both patterns in a flat space can take more dimensions than a curved space needs. This paper lets a Transformer learn the geometry of the network from the task it is trained to solve.
Key Findings
The two benchmark tables below come from the TAG-ML workshop paper. The September 2023 preprint supplies the figures reproduced here.
A flat map can pull neighbors apart
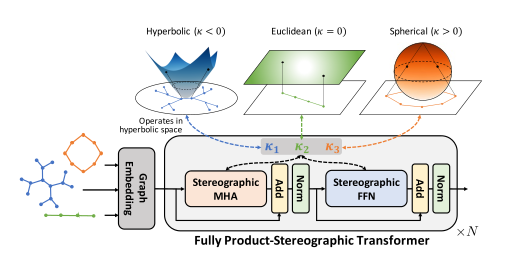
A web page can belong to a hierarchy of sites and link across several communities. A graph embedding puts each page at a point, hoping that linked pages will stay close. Flat space can be a poor fit for branching hierarchies. A graph can also contain regions that look more like a grid or a set of cycles. The authors build a Transformer that can learn several curvatures at once so its attention heads have different geometries available.
Let each head choose how its space bends
The model’s factors use stereographic coordinates, which describe curved spaces with coordinates that the network can manipulate. A negative curvature gives a hyperbolic factor, zero gives a flat factor, and a positive value gives a spherical one. Each attention head has its own learnable curvature. Their outputs combine into a representation whose geometry can vary across factors.
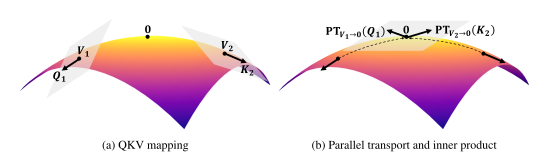
The authors extend the Transformer’s linear layers, nonlinearity, normalization, and residual operations to this setting. Attention needs special care because the queries and keys live in tangent spaces at different points. To compare them, the model transports them to a common point. In Equation 6 of the preprint, and are query and key vectors at their respective value points and . Parallel transport, written , moves those tangent vectors to the origin while respecting the geometry. The attention score is the inner product of the transported vectors there.
The head then uses a curved-space weighted average of its values, the Einstein midpoint, to combine information. At the origin the metric has a simple form. That lets the authors use a kernel approximation to compute attention without constructing the full pairwise matrix. At fixed feature dimensions, the approximation reduces the cost to linear in the number of tokens. The method inherits node and edge tokenization from TokenGT, so the token count is the sum of nodes and edges.
See when the geometry earns its place
The authors first ask the model to redraw a map it has already seen. If two pages link to each other, their embeddings should rank high as neighbors. Mean average precision rewards finding those neighbors throughout each ranked list. Since the model sees the target network during training, the test concerns faithful reconstruction of known links. Forecasting links that have yet to appear would call for a different test. The results below come from Table 1 of the workshop paper. They are mean average precision with 95% confidence intervals across five random seeds.
| Network | TokenGT mAP | FPS-T mAP |
|---|---|---|
| Web-Edu | 89.56 ± 0.03 | 99.00 ± 0.08 |
| Power | 99.08 ± 0.00 | 99.18 ± 0.06 |
| 84.62 ± 0.13 | 86.06 ± 0.06 | |
| Bio-Worm | 97.75 ± 0.03 | 97.90 ± 0.16 |
Web-Edu has the most negative mean sectional curvature of these four networks and shows the biggest gain. In a separate single-head Web-Edu run, the learned curvature moves in the negative direction during training. The smaller-dimension comparison shows another potential use. On that test, the curved model with four dimensions and 12,700 parameters reaches 92.00 mAP, while the flat model with sixteen dimensions and 53,600 parameters reaches 89.13. These results show the geometry’s value on that network. The smaller differences on the other networks give a sense of how much the benefits depend on the graph. Workshop Table 1 and Figure 2
Label a node when its neighbors disagree
In the separate classification task, neighboring nodes sometimes have different labels. A local message-passing rule can struggle when the useful signal is farther away. The authors compare classifiers on eight networks with different levels of neighbor-label agreement. FPS-T leads on mean F1 in six, including Actor, where it reaches 39.61 against TokenGT’s 36.59. Citeseer and Pubmed go the other way, and some of the leading comparisons have overlapping confidence intervals. These results give a practical reason to evaluate geometry under more than one objective. A head that represents a branch compactly may preserve the links between web pages without capturing what those pages discuss. The classification task depends on node features as well as links, so a method’s gains can change when the task switches from mapping connections to predicting labels. Workshop Table 2
Questions & Answers
The opening answers are simulated author responses based on the paper.
Q: Why mix several curvatures?
A: A single network can contain several kinds of structure. Different factors can represent relationships that are difficult to fit in the same flat space.
Q: Does every graph benefit equally?
A: The reported gains differ substantially by graph and task. On the Power reconstruction benchmark, both graph Transformers already score above 99 mAP.
Q: Does reconstructing a network show that it can predict new connections?
A: The reconstruction task uses an existing graph. Predicting which edges will appear later requires training on an earlier snapshot and holding back later links. Node classification differences can also be small relative to the reported intervals. Compare with a Euclidean model at the same representation size to separate the effect of curvature from extra capacity.
Future Ideas
Audit a knowledge graph for misplaced links
Build a pilot on a product knowledge graph with hierarchical categories and overlapping compatibility networks. Train mixed-curvature and Euclidean Transformers at the same embedding size. Ask both to surface likely missing links in a later snapshot and have catalog maintainers review a blind sample. Compare precision at a fixed review budget, category depth, and peak memory. Use typed relation baselines to test whether curvature adds value beyond knowing what each link means.
Use a time split with newly added nodes and compare against a baseline that models edge types. Match embedding size and report compute for each model.