Overview
A community's highest-ranked answer can tell us which response people preferred. It rarely says whether the deciding factor was accuracy, safety, clarity, or a tradeoff among them. MERIT uses those rankings to recover reusable standards for evaluating answers. A trained judge then reports how an answer scores on each criterion and how those scores contribute to its overall assessment.
Key Findings
Recover the criteria behind a ranking
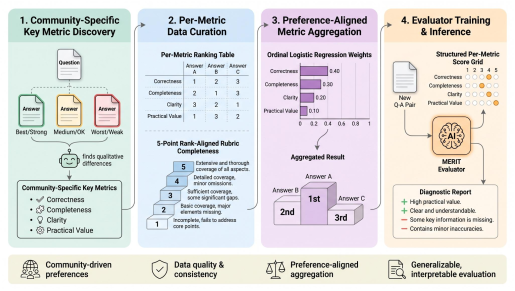
A vote ordering identifies which answer was preferred, while several different quality judgments could explain that ordering. MERIT starts with a question and three ranked answers. It asks a model to identify the differences among them, consolidates recurring distinctions into community-level metrics, and includes a human review step to merge redundant or overly narrow criteria. The manuscript organizes the training communities into 19 Stack Exchange communities and 20 Stack Overflow tag communities.
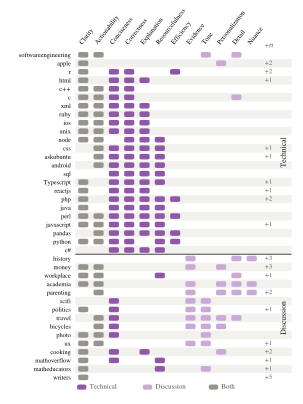
The metric inventory differs by community. Figure 3 separates many technical criteria from qualities more common in discussion communities. Appendix Table 7 gives examples. A standard for financial advice would lose information if it inherited a programming rubric that accounts for correctness and efficiency but never asks about scam risk.
| Example community | Selected induced criteria from Appendix Table 7 |
|---|---|
| Money | Financial analysis, scam risk, alternative approaches, and evidence |
| Math educators | Rigor, pedagogy, examples, and relevance |
| Academia | Nuance, personalization, empathy, and evidence |
| Ask Ubuntu | Troubleshooting, specificity, correctness, and completeness |
Filter rankings that the metric scores can explain
The training data start with observed answer orderings. The filter asks gpt-oss-120b to infer per-metric rankings and an overall ordering, then retains a triplet when that overall ordering matches the observed one. In the supplied manuscript, 53,574 of 190,206 triplets pass, a retention rate of 28.17%. Qwen3-32B then writes five-point rubrics and assigns scores informed by the per-metric comparisons.
The filter prioritizes examples with a recoverable ordering. Agreement on the final rank alone leaves room for two judges to assign different per-metric explanations. Rankings also reflect who saw or voted on an answer, rather than a controlled evaluation of every answer. Filtering makes the supervision more internally consistent while preserving those limits.
Fit the tradeoff between metrics and train a single-answer judge
The observed rank gives the aggregation step a target. In Appendix E, rank categories run from 1 for the worst answer to 3 for the best. For answer from community , the proportional-odds model uses metric scores to fit thresholds and coefficients .
The paper normalizes the fitted coefficients to obtain weights . Its scoring rule first computes the weighted sum and then rescales it to 0–100 using a reference score range.
The same metric scores can yield different judgments when communities weight them differently. Qwen3-8B and Qwen3-32B are fine-tuned on the induced standards so that, given one question–answer pair and a target community, the evaluator generates the metrics, rubrics, scores, weights, and overall judgment. It does not require all candidate answers at inference. To evaluate rankings, independently score each answer and then sort the scores.
Separate transfer from exact ordering on familiar communities
Table 1 uses exact match, the fraction of examples on which the complete predicted ordering equals the reference ordering. Holding out questions within the training communities tests a different kind of generalization from holding out entire communities. The LFQA slice uses pairs, while the other columns below use triplets, so their percentages should be compared within columns.
| Evaluator | Held-out community questions | Unseen Stack Exchange communities | LFQA-HP-1M sample |
|---|---|---|---|
| Qwen3-32B chain-of-thought prompt | 43.08% | 25.52% | 67.01% |
| Qwen3-32B structured prompt | 44.44% | 26.70% | 53.82% |
| Qwen3-32B rank-only fine-tuning | 25.81% | 10.99% | 49.10% |
| MERIT on Qwen3-32B | 52.14% | 27.31% | 72.36% |
| GPT-5.2 structured prompt | 61.54% | 32.56% | 68.75% |
MERIT improves over same-backbone rank-only fine-tuning in each of these settings. The gain over same-backbone structured prompting is 7.70 points on the held-out set and 0.61 points on unseen Stack Exchange. GPT-5.2 structured prompting still scores higher on both of those Stack Exchange sets, while MERIT leads that particular comparison on the LFQA pairs. Structured supervision helps in this comparison, but its advantage does not transfer uniformly.
Identify which components help and what reviewers prefer
Figure 4 varies filtering, metric choice, and aggregation in separate experiments. They are different comparisons, so the changes should not be added together.
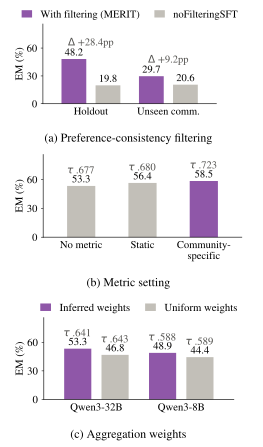
| Component test | Exact-match results from Figure 4 |
|---|---|
| Filtering, Qwen3-8B | 48.2% with filtering vs. 19.8% without it on held-out questions. On unseen communities, 29.7% vs. 20.6% |
| Metric choice, GPT-5.2 | 53.3% without listed metrics, 56.4% with static metrics, and 58.5% with induced community metrics |
| Aggregation, Qwen3-32B | 53.3% with inferred weights vs. 46.8% with uniform weights |
In the 32B aggregation comparison, Kendall's moves from .643 with uniform weights to .641 with inferred weights even as exact match rises. Exact match asks whether the full ordering is right. Kendall's captures pairwise ordering agreement. Improving one does not guarantee improving the other.
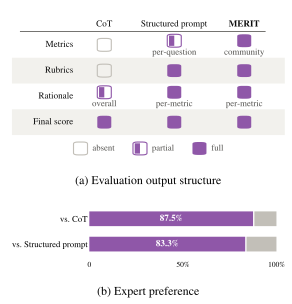
The human study analyzed 24 people after exclusions. 21 of 24 preferred MERIT's reports to chain-of-thought reports, and 20 of 24 preferred them to structured prompting. Participants described shared scoring dimensions and clearer explanations of how particular answers could improve. Those judgments are evidence about the usefulness of the reports. The automatic experiment separately tests agreement with the reference rankings, which remains a measure of community preference.
Questions & Answers
Q: How is a metric different from a rubric or a weight?
A: A metric names a dimension of quality. A rubric describes what each score on that dimension means. A weight reflects how much that dimension contributes to the overall evaluation for a particular community.
Q: Does community preference establish objective quality?
A: The preference signal records how answers were ranked by participants on one platform. It can reflect exposure, popularity, or local norms. Examining individual criteria and testing the evaluator with intended users are especially useful when those preferences may not transfer.
Q: What does the comparison with rank-only training show?
A: On these backbones and datasets, fine-tuning on answer orderings alone performed worse than training on structured score-and-rationale targets. The ablations additionally test the contributions of filtering, community-specific metrics, and learned aggregation.
Future Ideas
Let an expert group inspect changes in its standards
Induce rubrics from two time periods or two groups within a professional community. Give reviewers a small set of matched answers and show where criteria or weights disagree. Ask them to identify which changes reflect a real shift in priorities and which reflect sampling or voting artifacts.
Evaluate the process against an expert-authored rubric and a frozen MERIT evaluator. Measure ranking agreement, the cost of revising a rubric, and whether reviewers find tradeoffs they would have missed in an overall score.
Sources
- Author-supplied anonymized manuscript, Sections 3–4, Figures 2–5, Table 1, and Appendices D–E. The supplied copy does not identify the authors.
- EACL 2027 conference schedule and acceptance notification date
Original abstract
Evaluating LLM outputs in expert domains requires diagnostic standards that reflect the specialized knowledge and values shared within a community of domain experts. However, existing approaches either depend on the acquisition of expert-annotated rubrics, which are costly to scale across communities, or use LLM-as-a-judge with generic criteria that are invariant across all expert communities, which are not grounded. In this paper, we introduce MERIT (Metrics, Evaluation Rubrics Induced from Traces), a scalable yet grounded framework for inducing community-specific evaluation standards from naturally occurring preference traces, such as ranked answers on online QA platforms. MERIT transforms these noisy behavioral signals into structured supervision by inducing reusable community-specific metrics, constructing rank-aligned rubrics and metric-level scores, and learning preference-aligned aggregation weights. The resulting supervision is used to train evaluator LLMs that produce metric-level scores, rationales, and an overall score. On held-out, unseen-community, and external domain-oriented benchmarks, MERIT outperforms rank-only training and general-purpose judges, achieving gains of 3.98–14.90 pp over same-backbone prompting baselines. Human expert studies further confirm MERIT’s advantage in consistency, transparency, and diagnostic value.