Overview
A helpful answer can begin halfway down a page, where few readers notice it. Another can stay near the top because it already has votes, gaining still more exposure and votes. Counterfactual Voting Adjustment asks how the answers would fare under the same starting conditions. Its aim is to recover a ranking less tied to the path that brought each answer to its current position.
Key Findings
When a site labels an answer “most helpful,” it publishes a judgment made under its own ranking rules. To see how much the ranking may have influenced the label, the researchers try to compare answers under a common distribution of positions and prior votes.
Reconstruct a changing page
At each step a reader can choose which answer to work with and then cast a positive or negative vote. Display rank affects which answers are likely to be seen. The balance of previous votes can influence the next vote. Each new vote feeds back into later exposure through the site's ranking rule.
The paper models both effects and estimates a standardized outcome. It estimates the expected probability of a positive vote averaged over the population distribution of display rank and vote history. The paper separately uses a case study to examine what happens at rank one and with an even vote ratio. That estimate depends on causal assumptions. In particular, the authors assume that conditioning on observable pre-reading features blocks confounding between position, vote history, and the next vote. Their implementation uses relative answer length as the main such feature. The source logs capture votes rather than all impressions, which limits the ability to test the exposure model directly. Model and identification assumptions
Compare rankings against two imperfect yardsticks
| Helpfulness proxy | Communities where CVA has smaller squared residuals than both baselines | Communities where CVA has higher Kendall rank correlation than both baselines |
|---|---|---|
| Comment sentiment scored by GPT-4o | 78.33% | 74.17% |
| GPT-4o helpfulness judgments | 77.50% | 75.00% |
These are win rates across the 120 largest communities in the preprocessed StackExchange dataset, comparing CVA with raw vote difference and the Chinese Voting Process. Residuals compare rank discrepancies after the paper's transformation, while Kendall's correlation measures how often answer pairs appear in consistent order. The semi-synthetic experiment generates votes using the authors’ own model with fitted coefficients, which mainly tests recovery under its assumptions. Both real-data proxies come from the same GPT-4o prompt and are imperfect measures of helpfulness. Table 3 · Semi-synthetic experiment
Put each answer under the same set of conditions
Let indicate a positive vote, denote the answer, and stand for the position and vote-history variables. The standardization idea can be written in simplified notation as
The first probability describes how the model expects votes on answer to go in each condition. The second gives every answer the same mixture of conditions. This equation is a compact description of the target quantity, not a replacement for the paper’s sequential voting model or its identification assumptions.
The same voting system produces different communities
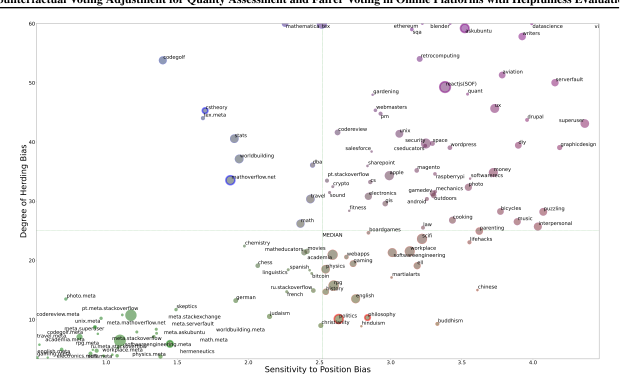
In the fitted model, rank sensitivity and herding vary across communities. Figure 1 uses those differences to map the 120 largest preprocessed StackExchange communities. The paper describes mathematics-oriented forums as relatively conforming with less sensitivity to rank, and meta communities as low on both measures. The map gives readers a way to compare the two modeled effects together. The authors offer interpretations for why communities land where they do, and those interpretations remain separate from what the fitted scores can establish.
Figure 6 provides a closer view for Politics. The model predicts a higher positive-vote probability when earlier opinions are mostly positive, and that probability also changes with rank. The figure shows the model’s conditional predictions for that community. See the rank and vote-ratio curves in Figure 6.
A simulated ranking can be checked against a hidden truth
The paper tests its estimator on synthetic data, where the underlying quality ranking is available by construction, and then on real communities, where it uses the comparisons in Table 2. The difference is important. A synthetic benchmark checks whether the estimator can recover a known ordering under the simulation. Real votes show how the adjusted ranking behaves under observed conditions. The latter exercise cannot directly reveal the counterfactual votes an individual reader would have cast.
Questions & Answers
The opening answers are simulated author responses based on the paper.
Q: Why can equal vote totals mean different things?
A: Votes arrive under different conditions. A positive vote on a lower answer can occur with less exposure, and a vote against an established majority arrives in a different social context. Our model uses the sequence of events to account for those differences.
Q: Why standardize at the top and with even previous votes?
A: Those settings specify a common hypothetical context for every answer. They let us compare predicted votes after holding two influential conditions fixed.
Q: Can old logs show what would have happened under a different ranking?
A: Only under assumptions about why answers were exposed and how users vote. Randomly varying display position or vote visibility would provide a more direct test.
Q: Is agreement with the paper's quality proxies equivalent to measuring actual helpfulness?
A: The real-data comparisons use proxies that the same language model scores. Comments also come from readers who chose to respond. The semi-synthetic test can check recovery when the proposed model generates the outcomes, but old voting logs do not give an independent measure of helpfulness. Separate those comparisons from blind ratings and experimentally observed impressions.
Future Ideas
Audit a community's helpfulness ranking with a small randomized trial
With moderator approval, vary the order of a few eligible answers on low-risk questions and hide vote totals from a randomized fraction of readers. Log impressions and use independent blind ratings of the answers. Fit the observational estimator on earlier logs, then test whether it anticipates the effects observed in the randomized sample.
Compare with raw score and a position-only adjustment. Measure blind-rated helpfulness near the top of the page, the visibility of late answers, and the number of readers who reach a useful answer. Keep a rollback rule if the experiment reduces answer discovery or disrupts moderation.
Decide in advance whether accepted answers remain fixed or enter the randomization. Report that group separately if the accepted-answer badge changes exposure.
Sources
Original abstract
Efficient access to high-quality information is vital for online platforms. To promote more useful information, users not only create new content but also evaluate existing content, often through helpfulness voting. Although aggregated votes help service providers rank their user content, these votes are often biased by disparate accessibility per position and the cascaded influence of prior votes. For a fairer assessment of information quality, we propose the Counterfactual Voting Adjustment (CVA), a causal framework that accounts for the context in which individual votes are cast. Through preliminary and semi-synthetic experiments, we show that CVA effectively models the position and herding biases, accurately recovering the predefined content quality. In a real experiment, we demonstrate that reranking content based on the learned quality by CVA exhibits stronger alignment with both user sentiment and quality evaluation assessed by GPT-4o, outperforming system rankings based on aggregated votes and model-based rerankings without causal inference. Beyond the individual quality inference, our embeddings offer comparative insights into the behavioral dynamics of expert user groups across 120 major StackExchange communities.