Overview
A post about a mixed-reality headset can praise what it enables and complain about how it feels to wear. A single positive or negative label hides that distinction. This study follows public Twitter discussion of HoloLens 2 around its release and the early COVID-19 pandemic, asking which features and uses people discussed.
Key Findings
A headset becomes part of a different conversation
HoloLens 2 arrived before much of the world moved work and training online. The study follows public discussion from November 7, 2019, through August 31, 2020. It collects 8,492 tweets with the product name or related hashtag, excludes ordinary retweets, and translates non-English posts for annotation. The researchers ask what people praise or criticize and whether the posts offer usable observations for developers, researchers and users.

Give the words a test set
Three annotators consider aspects such as comfort, field of view, cost and development, as well as whether a post offers a practical insight. The binary sentiment experiment uses 527 positive and 229 negative examples, with an 80:20 split. The study compares four classifiers and four text representations. A bag-of-words representation counts words without tracking their order. Its random forest has the highest reported test accuracy among those combinations. On the validation set, the random forest’s TF-IDF score is higher than its bag-of-words score, a reminder that the ordering depends on which split is examined. Methods · Table 2
| Classifier with bag-of-words | Test accuracy |
|---|---|
| Logistic regression | 69.03% |
| Random forest | 81.29% |
| XGBoost | 72.25% |
| Support vector machine | 75.48% |
There are roughly 150 posts in the test split and positive labels are more common. Accuracy gives the share labeled correctly overall. It does not reveal how often the system misses a negative report.
Follow the monthly conversation and the practical advice
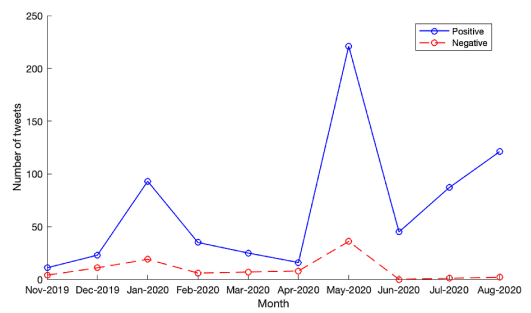
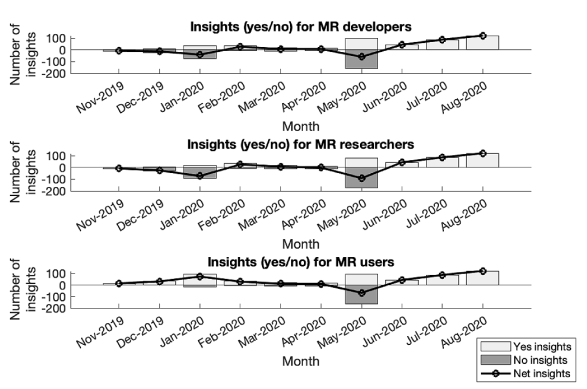
The paper describes attention to health-care education and training during the pandemic, including posts describing how staff could use the headset to deliver remote care. The source measures attention to such uses through posts. Clinical effectiveness and adoption would require separate evidence. One plot tracks positive and negative discussion over time. A separate plot counts posts judged useful for people who might develop, study or use mixed reality. Those posts become substantially more numerous relative to the rest in May 2020. The timeline places the shift alongside the pandemic. It cannot isolate the pandemic’s effect from changes in who posted, what news circulated, or how many posts appeared that month.
A favorable count still has a denominator
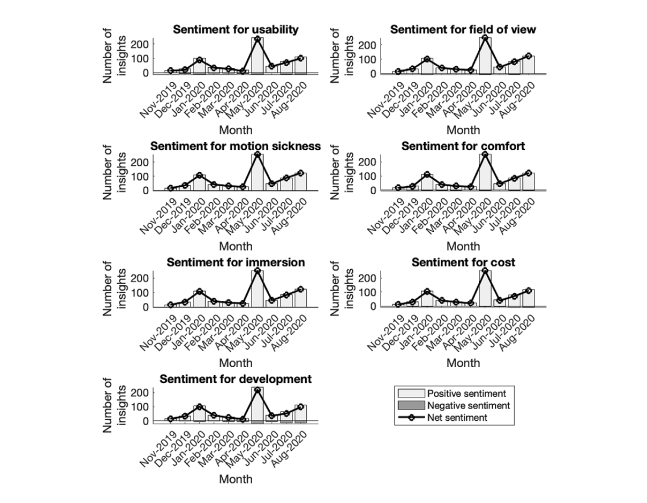
For each aspect, the article defines net sentiment as . The count peaks in May for each of the study’s seven categories. These selected values show the scale of the shift in four device aspects. Table 3
| Net sentiment count | Usability | Field of view | Comfort | Development |
|---|---|---|---|---|
| April 2020 | +12 | +24 | +24 | +12 |
| May 2020 | +235 | +249 | +253 | +219 |
| June 2020 | +45 | +45 | +45 | +35 |
More posts can raise net sentiment even if the positive share stays constant. Reading the positive and negative bars separately helps assess what changed in the discussion. A hashtag corpus tells us who happened to post during the period, with some viewpoints likely represented more often than others.
Questions & Answers
The opening answers are simulated author responses based on the paper.
Q: Why examine sentiment by aspect?
A: A single device can have strengths and weaknesses that appear in the same discussion. Separating aspects helps researchers locate the feature that deserves a closer look.
Q: Can these posts represent all headset users?
A: The sample reflects public tweets captured by the collection process. Users who post, use different terms, or stay silent may have different experiences.
Q: Does the increase in online discussion establish what the pandemic changed?
A: The timeline establishes how the sampled posts changed. It cannot distinguish the pandemic’s causal effect from changes in product news, who posted, or how often they posted. The classifier’s 72.79% validation accuracy and 81.29% test accuracy also show why the results should be read alongside the small labeled test sample. The posts can point a product team toward a question it should ask actual users.
Future Ideas
Turn a discussion spike into a product question
Build an aspect dashboard that shows post counts and sentiment proportions together. Sample new spikes for blinded manual review, group duplicate announcements, and recruit a separate panel of 30 headset users from a workplace deployment and ask whether the issue appears in their experience. Compare manually confirmed findings with a dashboard based only on overall sentiment.