Overview
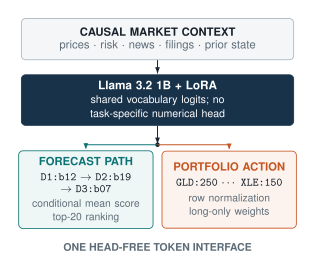
A language model can describe a market trend fluently and still emit a malformed number. Portfolio weights must also add up and respect the allowed positions. FinATOM restricts the output vocabulary and grammar, then decodes the resulting tokens into forecasts or long-only allocations.
Key Findings
A language model can write the sentence “allocate more to bonds.” An allocation system has to commit to a number, and all the numbers have to add up. This study uses constrained numerical tokens to make that difference part of the model’s output format.
Give each decision a numerical contract
The forecasting task emits three volatility-standardized return bins in order. The allocation task emits grid-valued weights for five exchange-traded funds and normalizes them. Both tasks adapt a Llama 3.2 1B backbone with LoRA and score added numerical tokens through the standard tied vocabulary projection. The allocation model first imitates a causal mean–variance target. A policy stage uses realized forward returns for its training reward, while inference uses only the information available at the decision date.
Selected results below are from Table 2. Sharpe summarizes return relative to variability. The causal target is a numerical comparison, and the 2025 test ends on October 31.
| Period | Supervised model Sharpe | Policy Sharpe | Causal target Sharpe | Equal-weight Sharpe |
|---|---|---|---|---|
| 2023 | 1.404 | 1.404 | 1.542 | 0.886 |
| 2024 | 1.445 | 1.564 | 1.407 | 1.367 |
| 2025 through October | 1.474 | 1.653 | 1.691 | 1.506 |
The policy improves on its supervised starting point in two of the three periods and ties in the other at the reported precision. Equal weight earns a higher raw annualized return in 2024 and 2025 in this table, alongside higher volatility. Across the 709 test days, the policy’s pooled gross Sharpe is 1.529 versus 1.428 for the supervised model. Under the paper’s five-basis-point cost model, pooled net Sharpe is 1.494 versus 1.394. The study uses one seed per setting.
Make the output a valid decision
The forecasting task and allocation task share an interface while encoding different quantities. In the allocation task, if is the nonnegative decoded grid value for fund , the normalization can be described as
when the denominator is positive. The resulting weights sum to one. This form explains the output constraint. The training procedure separately learns the targets from market context and realized returns.
Test inputs and policy learning separately
The paper includes several test periods, a controlled input-modality ablation, and comparisons between imitation and policy training. The separation matters in finance because the value of one signal can shift across market regimes. The pooled gross Sharpe increases from 1.428 for the supervised policy to 1.529 after policy optimization. The mean–variance target reaches 1.540. The paper also finds that combined news and time-series inputs lead in 2025, while time series alone edges ahead in 2023 and 2024 in the modality ablation. The test covers three single-run periods. It demonstrates how to check the contribution of inputs and training stages under changing conditions.
Questions & Answers
The opening answers are simulated author responses based on the paper.
Q: Why use constrained tokens instead of ordinary number strings?
A: The output grammar restricts the values and structure. A deterministic decoder converts legal strings into the numerical object required by the task.
Q: Does higher Sharpe mean higher raw return?
A: No. The measure accounts for variability. The table includes periods where equal weighting earns more raw return and has lower Sharpe.
Q: Which part of the experiment is most likely to transfer to another decision system?
A: Constrained decoding provides a way to produce values and allocations that software can parse and check. The financial comparison covers five funds, a limited historical period, and one training seed per setting. The same interface can be tested on other numerical tasks, while any claim about financial performance needs its own out-of-sample comparison with costs and uncertainty.
Future Ideas
Replay a numerical decision pipeline before it can trade
Build a shadow evaluator that records the decoded allocation, timestamped evidence, turnover, and any difference from a simple causal rule. Use several historical windows and predeclared transaction-cost settings. Test malformed and missing inputs, and report both parsing reliability and risk-adjusted results. No orders are needed for the comparison.
Start with a passive replay comparing all methods on identical dates. Report predictive accuracy and output validity separately from net returns, and include benchmark uncertainty across dates and regimes before interpreting a risk-adjusted gain.
Sources
Original abstract
Financial prediction typically relies on task-specific regression, ranking, or policy heads, separating the language model from the numerical object ultimately evaluated. We investigate whether a causal language model can instead represent forecasts and decisions directly through constrained token generation. FinATOM introduces a unified, head-free interface for three-step stock-return forecasting and dynamic five-ETF allocation. The forecasting model autoregressively emits volatility-standardized return tokens and is trained with ordinal and ranking supervision followed by a one-epoch token-level policy stage. The allocation model generates normalized long-only weights; supervised fine-tuning imitates a causal mean--variance anchor, and DAPO-augmented GRPO optimizes realized 21-day Sharpe subject to anchor consistency. In 2023--2025 ETF tests, the allocation policy improves pooled gross Sharpe from 1.428 to 1.529 and net Sharpe under a 5-bp transaction-cost model from 1.394 to 1.494. The multimodal allocation input attains the highest three-period mean Sharpe of 1.540, with its clearest advantage in 2025. On FinTexTS, the SFT and policy strategies achieve 73.52%/2.68 and 73.72%/2.69 cumulative-return/Sharpe, respectively. These results support the feasibility of direct language-model token generation for financial numerical prediction and decision-making, while motivating broader tests across assets, regimes, and random seeds.